Smoker Automation and Monitoring Part 2
In my Previous Post I gave a brief overview of my automated smoker project. In this post we will further discuss the monitoring stack and how we’re able to get the temperature from the standalone thermometer into Grafana.
First things first, we need a few pieces of hardware.
- wireless thermometer one from Amazon is what I used.
- Raspberry pi (or any computer capable of running docker)
- rtl-sdr dongle and antenna
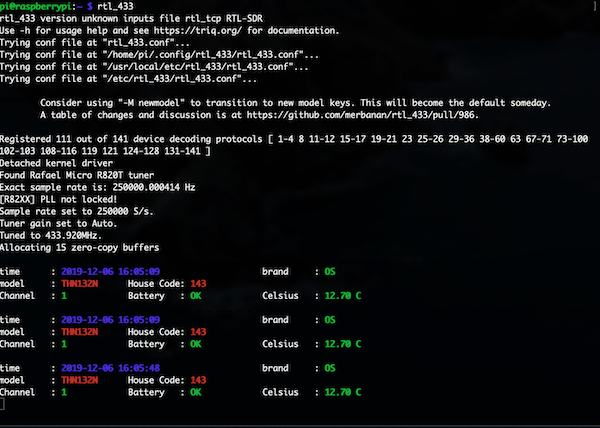
The rtl-sdr dongle was originally designed to receive European broadcast TV signals, but is now mostly used by hobbyists to receive various radio signals on a computer. One of the open source projects that was born from this is RTL_433. RTL_433 is a really powerful data collection program that will allow us to decode the transmissions of the wireless therometer.

When the thermometer base unit transmits an update, rtl_433 decodes that update and sends the data via MQTT to Telegraf. Telegraf then stores the raw metrics in InfluxDB. Once the data is in Influx, displaying and alerting on it is the same as it is monitoring a server’s CPU utilization or any other metric. Using InfluxDB as a datasource in Grafana we can quickly create custom graphs, stats or alerts based on the temperatures.

