
Smoker Automation v2: To The Cloud
Since my last post nearly a year ago, I have made some major changes to my BBQ monitoring stack. In order to minimize the overhead of running Grafana and InfluxDB locally, I’ve created free instances of both. There are obviously some limitations, Grafana limits the number of dashboards and InfluxData limits the number and type of alerts, and drops all measurements after 30 days. For our purposes, that’s totally fine. The following sections are organized based on the flow of data from the thermometer up the stack.
RTL-SDR and RTL_433
As mentioned in my first post, I use the open source rtl_433 and an inexpensive rtl_sdr dongle with an antenna to literally pull the bits out of the air. Since my last post, rtl_433 has added native support for InfluxDB. This, in theory, greatly simplifies the technology stack, removing the need for MQTT and telegraf as a middleman. In practice, however, I am struggling to get rtl_433 to talk to each other. Until I’m able to overcome this hurdle, I’m using telegraf as a middleman. I’ve set up an influx listener that outputs to the cloud listener. For my purposes, this works fine and is very lightweight on my Raspberry Pi.
Another annoyance I had was that the thermometer always transmits in Celsius, regardless of what’s configured to display. While it’s easy enough to do the math to convert from Celsius to Farenheit when visualizing, using the -C customary option does it all for you before sending the raw data to InfluxDB. This makes it much easier to use Influx’s native alerting without having to do extra math. To run influxdb with these options to output to a local instance of telegraf, run
rtl_433 -M newmodel -F "influx://localhost:8086/write?db=rtl433" -C customary
I installed rtl_433 as a service so it will automatically start at boot. To install rtl_433 as a service, create a file /etc/systemd/system/rtl_433.service with the below content:
[Unit]
Description=RTL 433MHz
After=network.target

[Service]
Type=simple
User=root
ExecStart=rtl_433 -M newmodel -F "influx://localhost:8086/write?db=rtl433" -C customary

RestartSec=0
Restart=always
RemainAfterExit=no

[Install]
WantedBy=multi-user.target
Visit https://www.raspberrypi.org/documentation/linux/usage/systemd.md or more information about installing a custom service in Raspbian.
Telegraf
Next, we need to install and configure Telegraf. First, download and install Telegraf by running the following on your raspberry pi:
wget https://dl.influxdata.com/telegraf/releases/telegraf-1.16.2_linux_armhf.tar.gz
tar xf telegraf-1.16.2_linux_armhf.tar.gz
Next, set up an InfluxDB listener by adding the following to etc\telegraf\telegraf.conf. This emulates an influx 1.8 endpoint and rtl_433 doesn’t know or care that it’s actually Telegraf that it’s talking to. Once we set up our cloud instance of InfluxDB we’ll add an InfluxDB 2.0 output to send the data up to the cloud.
[[inputs.influxdb_listener]]
  service_address = ":8086"
  read_timeout = "10s"
  write_timeout = "10s"
  max_body_size = 0
  max_line_size = 0
InfluxDB
This is where things start to get interesting. Sign up for a free cloud instance at https://cloud2.influxdata.com/signup. I just use my google credentials. Choose your favorite cloud provider (this is useful/relevant in certain scenarios where you’re monitoring systems in one of the public clouds and want to save bandwidth), pick a company name (I chose DadOps), and agree to their terms of service. Continue on and select the free plan. Click ‘Load your data’ and then select ‘Yes, load my data’. Click ‘Collect Data with Telegraf Agent’ and follow the instructions. When asked to select a plugin, select ‘system’. Name the configuration and continue. If you’d like, you can use the command they give you to create an environment variable to keep your token out of the config file. It’ll look something like below (no, the example below isn’t a valid token).
export INFLUX_TOKEN=TCbjR_AHDV9h5ztuas134Bie3Aau7UaNPE_m6Hxt7ZjTCHJqpZjhkIFdAAmZLGkqyEt6vKUSF4DZ6RnY5bSoAg==
Click finish and then click on the configuration you just created. A long config file should pop up. scroll down until you see [[outputs.influxdb_v2]] and highlight everything below it up to, but not including, the [[inputs.cpu]] line. It should look something like this:
[[outputs.influxdb_v2]]
  ## The URLs of the InfluxDB cluster nodes.
  ##
  ## Multiple URLs can be specified for a single cluster, only ONE of the
  ## urls will be written to each interval.
  ## urls exp: http://127.0.0.1:9999
  urls = ["https://eu-central-1-1.aws.cloud2.influxdata.com"]

  ## Token for authentication.
  token = "$INFLUX_TOKEN"

  ## Organization is the name of the organization you wish to write to; must exist.
  organization = "dadops"

  ## Destination bucket to write into.
  bucket = "dad's Bucket"
paste that directly underneath the omit_hostname = false line in the telegraf.conf file you modified earlier, and restart telegraf and rtl_433. sudo service telegraf restart && sudo service rtl_433 restart. At this point you should be collecting data in influx cloud. In your browser, go back to the InfluxDB dashboard and select Data on the far left, then select buckets. Click on the bucket you created and you should see some data in the bucket you created. What you see will depend on your antenna system as well as what kinds of sensors are nearby.
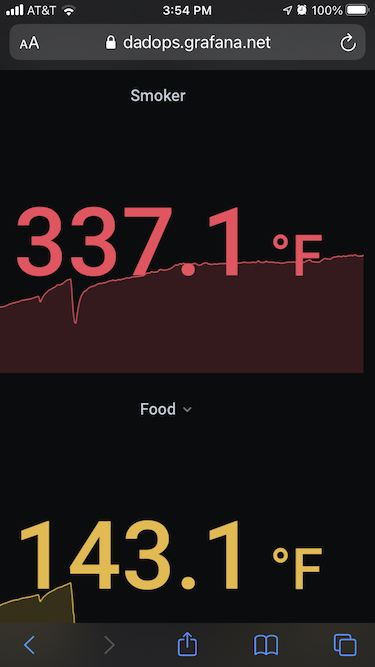
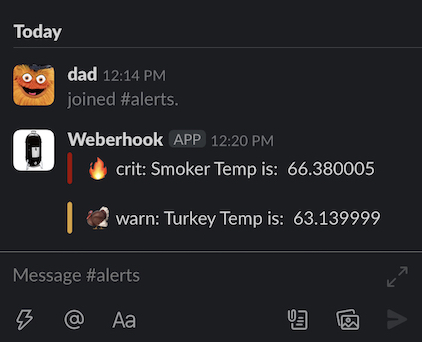
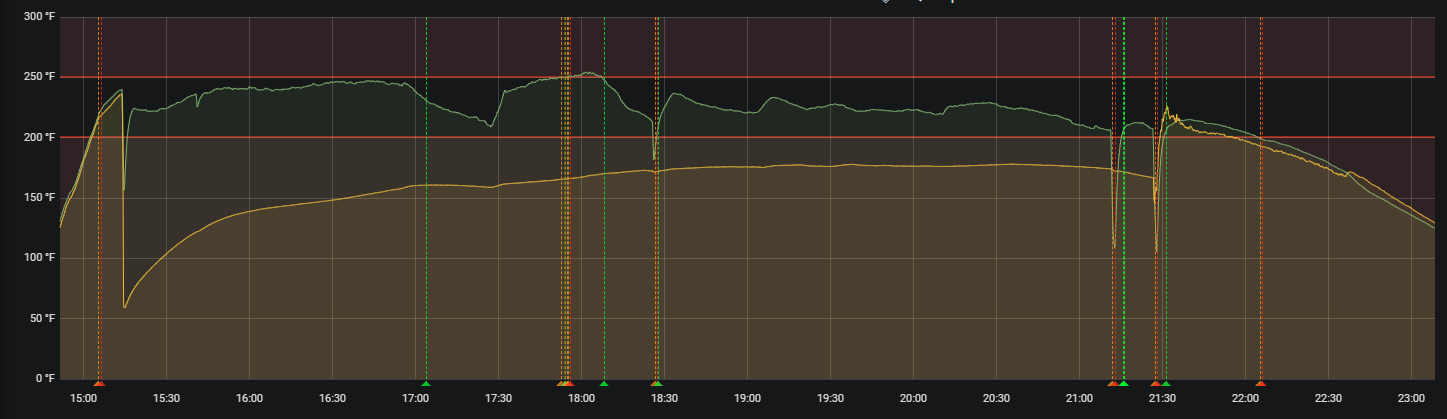
Congratulations! You’re now feeding data into the cloud from your Raspberry Pi. I’ll be adding another post in the next day or two showing how I set up Grafana dashboards and Slack alerts like these.